The Neighborhoods at Brookview

The key quality measures below have been chosen by Federal and state agencies as measurements of high quality long-term care. To see how The Neighborhoods at Brookview compares in other dimensions, please visit the Care Compare website.

NBV Star Rating

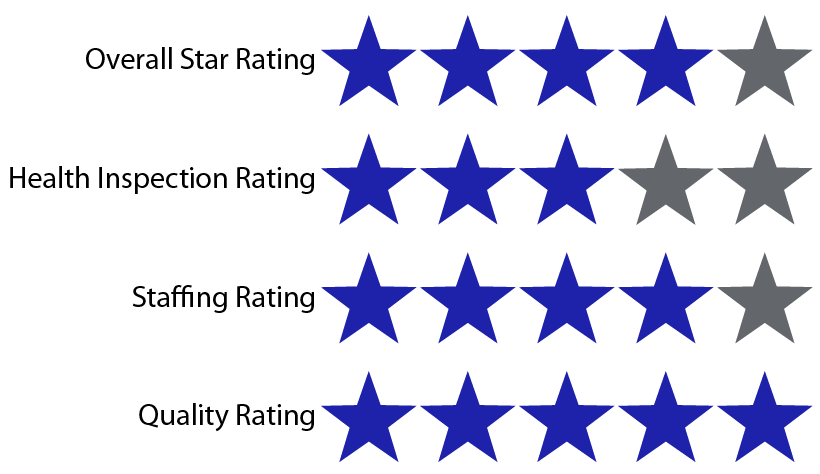
Star Ratings for The Neighborhoods (data from January 2024 report)

Measures from Care Compare

The information below shows quality of resident care at The Neighborhoods at Brookview compared to state and national averages. Care Compare uses these measures to show how often nursing homes provide care that research shows gets the best results for residents. More information on The Neighborhoods and other nursing homes can be found on the Care Compare website. Data from July, 2022 - June, 2023.

MeasuresThe Neighborhoods at BrookviewSouth Dakota AverageNational Average
Percentage of short-stay residents who were re-hospitalized after a nursing home admission (Lower percentages are better)11.7%18.8%23.1%
Percentage of short-stay residents who have had an outpatient emergency department visit (lower percentages are better)3.1%12.6%12.1%
Percentage of short-stay residents who got antipsychotic medication for the first time (lower percentages are better)0.0%1.7%1.8%
Percentage of short-stay residents with pressure ulcers/pressure injuries that are new or worsened. (Lower percentages are better)6.9%N/A2.4%
Percentage of short-stay residents who improved in their ability to move around on their own (Higher percentages are better)82.3%82.3%76.7%
Percentage of short-stay residents who needed and got a flu shot for the current flu season. (higher percentages are better)90.5%79.4%76.2%
Percentage of short-stay residents who needed and got a vaccine to prevent pneumonia (higher percentages are better)90.7%85.8%79.7%
Percentage of residents whose medications were reviewed and who received follow-up care when medication issues were identified (higher percentages are better)100%N/A93.7%
Percentage of SNF residents who experience one or more falls with major injury during their SNF stay (lower percentages are better)0%N/A0.8%
Percentage of SNF residents whose functional abilities were assessed and functional goals were included in their treatment plan (higher percentages are better)88.5%N/A99.1%
Percentage of residents who are at or above an expected ability to care for themselves at discharge (higher percentages are better)36.7%N/A50.5%
Percentage of residents who are at or above the expected ability to move around at discharge (higher percentages are better)28.6%N/A46.3%
Change in residents' ability to move around (higher scores are better)12.7N/A18.7
Percentage of SNF healthcare personnel who completed COVID-19 primary vaccination series (higher percentages are better)88.5%N/A87.0%
Rate of successful return to home and community from a SNF (higher rates are better)No different than the national rateN/A49.7%
Rate of potentially preventable hospital readmissions 30 days after discharge from a SNF (lower rates are better)No different than the national rateN/A10.5%
Percentage of infections patients got during their SNF stay that resulted in hospitalization (lower rates are better)No different than the national rate N/A6.9%
Medicare Spending Per Beneficiary (MSPB) for residents in SNFs. (displayed as a ratio)1.04N/A1.02


MeasureThe Neighborhoods at BrookviewSouth Dakota AverageNational Average
Number of hospitalizations per 1,000 long-stay resident days (lower numbers are better)1.611.381.87
Number of outpatient emergency department visits per 1,000 long-stay resident days (lower numbers are better)0.540.991.20
Percentage of long stay residents who got an antipsychotic medication (lower percentages are better)22.3%21.3%14.7%
Percentage of long stay residents experiencing one of more falls with major injury (lower percentages are better)10.7%5.3%3.4%
Percentage of long stay residents with pressure ulcers (lower percentages are better)3.2%7.8%7.3%
Percentage of long stay residents with a urinary tract infection (lower percentages are better)3.7%4.0%2.2%
Percentage of long stay residents who have or had a catheter inserted and left in their bladder (lower percentages are better)1%2.1%1.3%
Percentage of long stay residents whose ability to move independently worsened (lower percentages are better)15.9%18.2%15.4%
Percentage of long stay residents whose need for help with daily activities has increased (lower percentages are better)13.8%16.9%14.2%
Percentage of long stay residents who needed and got a flu shot for the current flu season (higher percentages are better)100%97.1%94.7%
Percentage of long stay residents who needed and got a vaccine to prevent pneumonia (higher percentages are better)100%96.9%92%
Percentage of long stay residents who were physically restrained (lower percentages are better)0%0%0.1%
Percentage of long stay residents who lose control of their bowels or bladder (lower percentages are better)46.7%52.0%48.5%
Percentage of long stay residents who lose too much weight (lower percentages are better)2.3%5.6%5.9%
Percentage of long stay residents who have symptoms of depression (lower percentages are better)1.1%5.9%8.9%
Percentage of long stay residents who got an antianxiety or hypnotic medication (lower percentages are better)15.2%15.0%19.4%